3Di Results Analysis is a major improved over the 3Di Toolbox. Many bugs have been fixed, and the source code has been largely rewritten from the 3Di Toolbox code, making it possible to fix further issues much quicker.
It is no longer possible to combine results with the wrong model, thus preventing errors.
Note
Development and bugfixes of 3Di Toolbox has ended. 3Di Toolbox is no longer supported by the service desk after October 1st. If you run into any issues while using the 3Di Toolbox, the service desk will ask you to install 3Di Results Analysis and try to perform the same tasks with that.
3Di Toolbox required you to load the spatialite (Schematisation data) first, and than add one or more simulation results. 3Di Toolbox would then attempt to map the simulation results to the schematisation data, which is not always possible (e.g. when 1D elements with calculation type embedded are used).
3Di Results Analysis consistently uses the conceptual separation of Schematisation data (spatialite + rasters), 3Di Model (computational grid and subgrid tables), and simulation results. It maps the simulation results (time series of flow variables) to the computational grid (locations of nodes and flowlines). It does not use the schematisation data at all.
This conceptual consistency makes it easier to understand what you are looking at, makes the software more stable and prevents strange, hard-to-solve bugs.
The Schematisation checker, Import from SUF-HYD and Import GWSW HydX still need the Spatialite. It may be necessary to directly view the Spatialite layers when using these tools, e.g. to understand certain error messages resulting from the Schematisation checker. The Spatialite will be phased out entirely and will be replaced by a GeoPackage, with a database schema that is similar to the database schema that the 3Di Schematisation Editor uses. The tools that interact with the Spatialite will be adapted to be compatible with GeoPackage and the new database schema.
While this development is ongoing, a so-called sunset version of 3Di Toolbox remains available. This sunset version will have only one functionality: loading the Spatialite layers in the 3Di Modeller Interface. It will be released in October 2023.
The Load model and results dialog has been replaced by the *Results Manager panel*. This panel cleary shows which computational grids are loaded and which results are loaded (and to which computational grid they belong). It also shows time since start of the simulation. The functionalities of the former Animation tool are also integrated in the Results Manager panel.
The Graph tool has been renamed to the Time series plotter. There are some changes:
- Each item in the plot is clearly labelled in the legend, so that there is no longer any confusion as to which line in the plot belongs to which model or which simulation.
- The main way to add items to the plot is Pick node/cell or Pick flowline/pump. Activate this map tool, and click on the map canvas to immediately add the clicked item.
- If you want to add multiple items at once, you can switch to the Add all selected items mode, which works in the same way as you are used to from 3Di Toolbox
- The Delete button has been replaced by a context menu (right-click the legend to remove all selected legend items).
- The Absolute option has been fixed. Check this box to visualise e.g. discharges in absolute terms, rather than signed (with negative numbers indicating flow opposite to the drawing direction).
The Side view tool has been rebuild almost from scratch. The main changes are:
Side views can also be made for computational grids without having loaded any results. This can be used to analyse the sewer system or open water system, or to find data errors in the schematisation.
Use the QGIS native Temporal controller to navigate through time, instead of the Animation toolbar (which no longer exists).
The Temporal Controller also has a Play button, which you can use to watch the water levels rise and fall in the side view plot.
The visualisation is much clearer
All flowline types are supported, including embedded channels
If multiple results are loaded, you can choose which result to visualise
If you have loaded results from simulations that were done with the same model (e.g. two different rain events), these results will be plotted within the same Side view plot, in a clearly distinghuisable way.
If you have loaded results from simulations that were done with different models (e.g. current situation vs. proposed improvements), you can open two Side view plot windows, set them to a different computational grid in the upper-right corner, and compare the differences as you scroll through time.
Statistical tool (replaced by Result aggregation)
The Statistical tool has been phased out, and has been replaced by the Results aggregation tool. This tool was previously available as beta plugin, named 3Di Custom Statistics. This beta plugin has been improved and extended in several ways, so that it can perform the tasks for which previously the Statistical tool would be used.
One of the most often used features of the Statistical tool was to calculate the duration of flooding from sewer water, or “Water on street duration”. This is now available as preset in Result aggregation tool.
Note
The Water on street duration (0D1D) and Water on street duration (1D2D) presets of the Result aggregation tool will give different results than the old Statistical tool. This is because the definition of “water on street” in the new Result aggregation tool is “1D water level is above the drain level (for 0D1D) / exchange level (for 1D2D)”. The Statistical tool defined it as “1D water level is above the manhole’s surface level”.
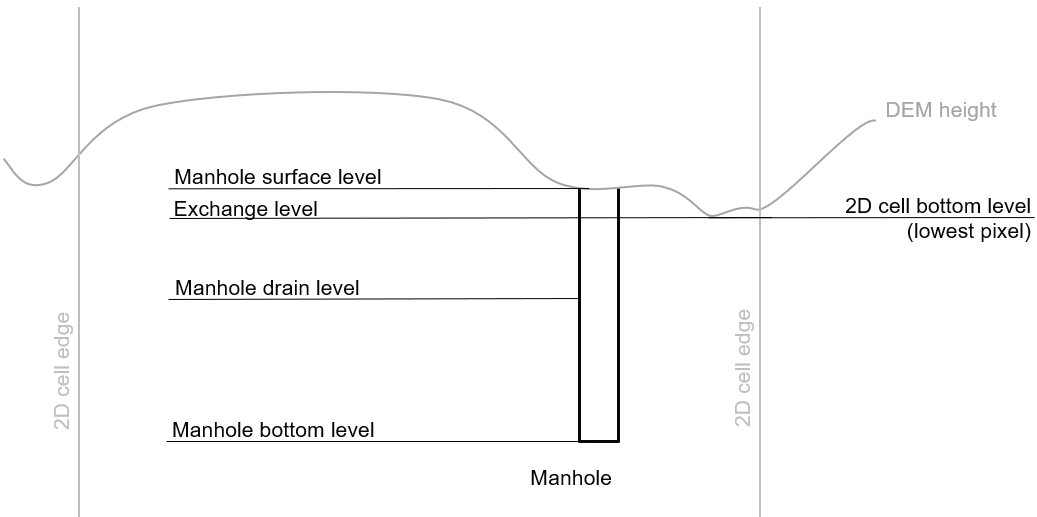
The figures illustrate the relation between the manhole drain level, the 2D cell’s lowest pixel, and the 1D2D exchange level.
Drain level above lowest pixel in the 2D cell
Manhole with a drain level below the 2D cell’s lowest pixel. The 1D2D exchange level that is used in the simulation equals the 2D cell’s bottom level.
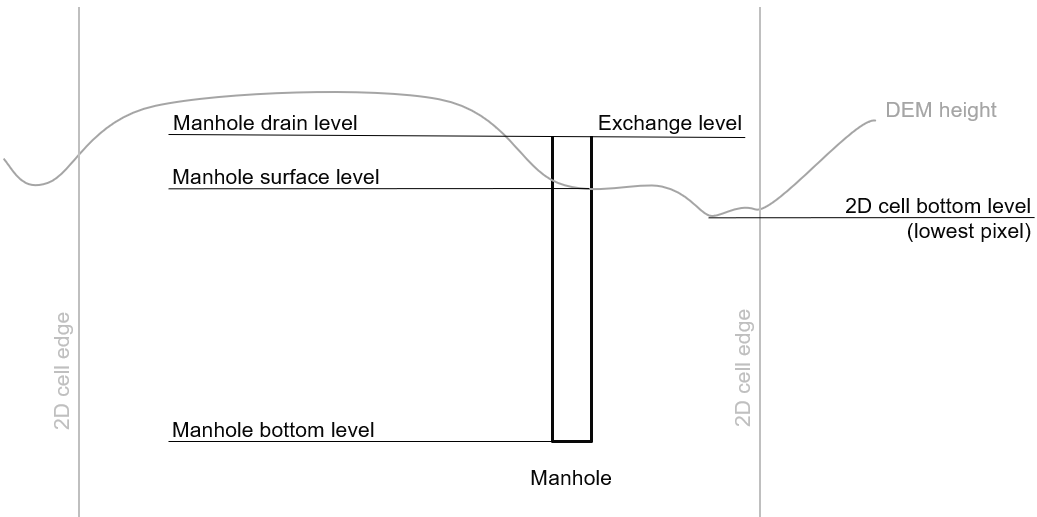
Drain level below lowest pixel in the 2D cell
Manhole with a drain level above the 2D cell’s lowest pixel. The 1D2D exchange level that is used in the simulation equals the manhole drain level.
While the statistical tool was used only for sewer systems, the Result aggregation tool is much more generic and works for all nodes and flowlines, and for all flow variables.
If there is any functionality from the Statistical tool that you are missing in the Result aggregation tool, please inform the Service desk so that this functionality can be added.
Water balances are calculated for a polygon picked from a polygon layer in your project. This makes it much easier to repeat the water balance analysis for the exact same area for new simulations. Note that you can no longer draw a polygon on the map canvas directly.
You can compare water balances for all the simulation results that were loaded. In both the temporal water balance plot and the Total water balance window, a separate tab will be created for each simulation result.
Flows that are not relevant for the loaded models are not shown in the legend, e.g. if none of the loaded models contains interception, interception will not be shown.
The user interface has been simplified; options that were rarely used have been removed.