Loading and visualising results in the 3Di Modeller Interface
Loading simulation results
To add computational grids and simulation results to your project, open the Results Manager from the toolbar ( ). Click
  in the upper right corner to search for the simulation results you want to analyse. You can choose from all simulation results that have been downloaded to your local 3Di working directory. Alternatively, switch to the Browse tab to browse for gridadmin.h5 or results_3di.nc files in other locations. Select the desired results file and click either Load computational grid or Load simulation results. Both options will load the computational grid into the Layers panel, but the latter option is required to see the results. You can also double click on a row to add the items to your project.
If multiple simulations have been run with the same 3Di model, the computational grid will be loaded once and both simulation results will be connected to the same computational grid.
To remove a computational grid or simulation result, either Right-click > Delete or select the item you want to remove and click  in the upper right corner.
To rename a computational grid or simulation result, Double-click it or select the item you want to remove and hit F2. Note that this will just change how the item is displayed in the 3Di Modeller Interface; it will not change the actual file or folder names.
Under General settings you can select whether or not the simulation start times are aligned (based on the simulation with the earliest start time) in case you have loaded multiple sets of results.
In the Visualisation settings you can select the flowline and node variables you want to view. By checking the Relative checkbox the node results are visualised as change relative to the initial values (t0).
Visualising results on the map canvas
To visualise the simulation results on the map canvas, click the  icon. This changes the styling of the computational grid layers, to show the flow variables chosen under Visualisation settings. The value ranges in the styling are based on the value distributions of these variables over the entire simulation.
By default, the last time step is visualised. Use the Temporal controller to navigate through time.
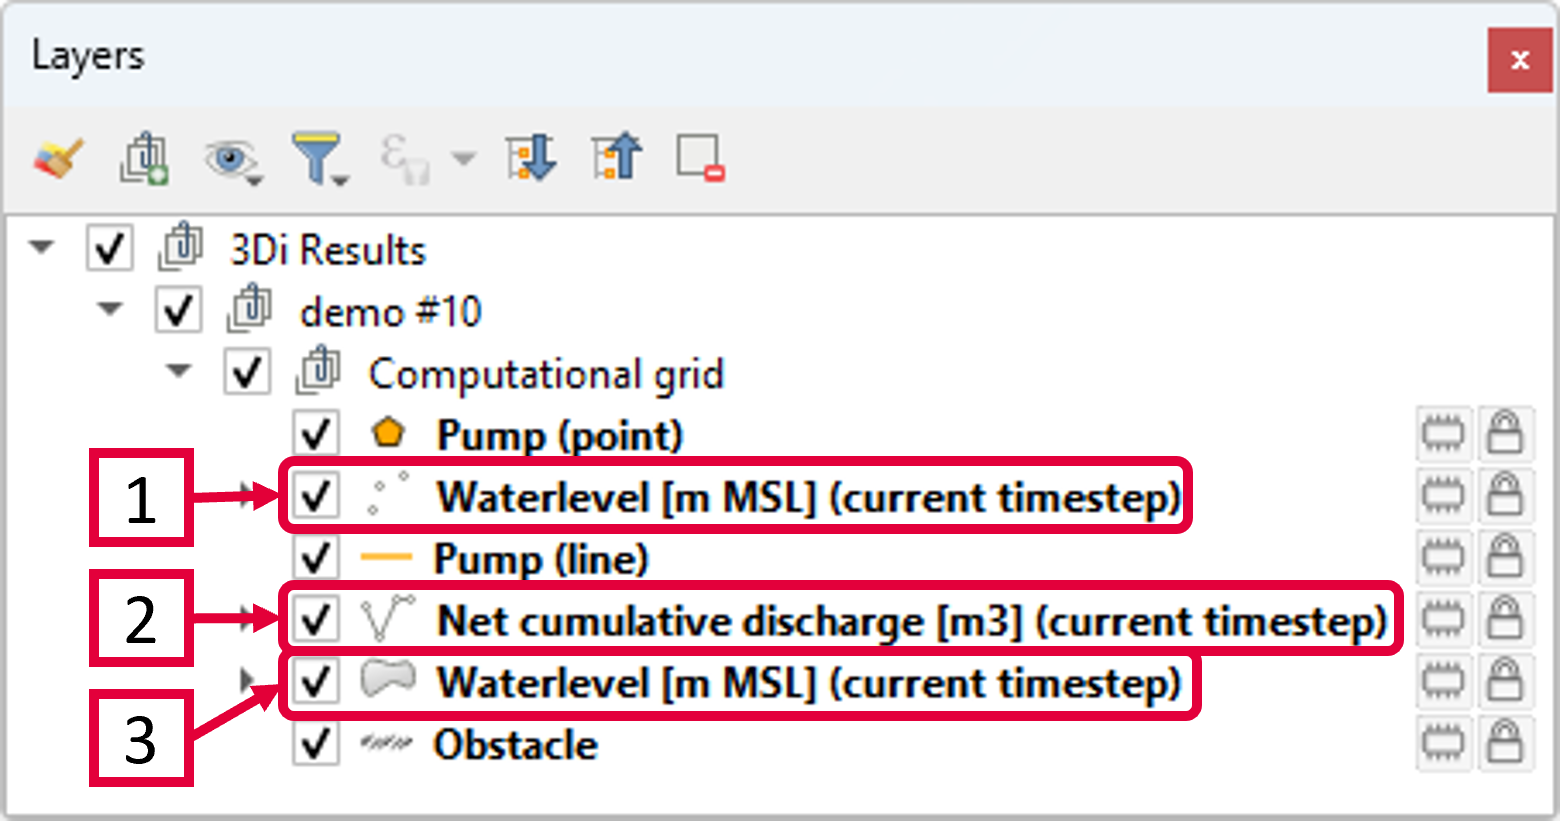
The 1D node results that correspond to the selected node variable in the Visualisation settings of the Results Manager.
The flowline results that correspond to the selected flowline variable in the Visualisation settings of the Results Manager. The results can by filtered to only show the specific flowlines you are interested in. To do this right click the ‘flowline_results’ layer (whose name corresponds to the chosen variable) and choose ‘Filter…’. The Query Builder will open. Double click ‘line_type’ in the box Fields and click ‘Sample’ or ‘All’ to see which types are available. In the box below you can specify the types of flowlines you want to see.
The 2D computational cell results that correspond to the selected node variable in the Visualisation settings of the Results Manager.