Visualisation tools
Opening the Map layers panel
Click on the Layer tool at the bottom left of the screen. The Map layers panel appears:
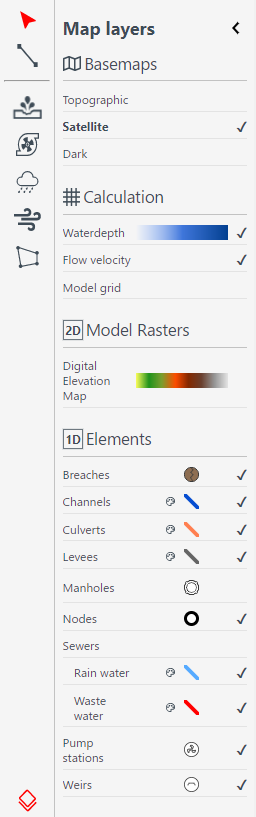
Fig. 11 Map layers panel.
Base maps
In the Map layers menu the background map can be chosen under Base maps
Topographic
Satellite (Default)
Dark
Calculation layers
In the Calculation section, you can toggle the visibility of layers that give insight in the simulation result and the computational grid:
Waterdepth shows you the proportional depth of the water on the 2D domain. The color scheme of the water depth can not be changed in 3Di Live.
Flow velocity shows the flow in the 1D elements, visualized by moving white dots. The size of the dots indicates the discharge, and the speed with which they move indicates the flow velocity.
Model grid shows the 2D cells on the map. Note that you need to zoom in sufficiently for the cells to be shown.
Model grid flow shows the 2D flowlines and 1D2D exchange flowlines of your model. Note that you need to zoom in sufficiently for the cells to be shown.
Model rasters
In the Model rasters section, you can toggle the visibility of the Digital Elevation Model.
1D Elements
If the model contains 1D elements, they are set to visible by default. Depending on which 1D elements are present in the model (and turned on in the Map layers menu), you will see:
Breaches (shown after zooming in)
Channels
Culverts
Levees
Manholes (shown after zooming in)
Nodes
Sewers
Pump stations
Weirs
Colors for all these layers can be changed according to your preferences by clicking on the small paint pallet next to the element.
Note
Manholes are turned off by default. Turning them on and zooming out may degrade the performance of 3Di Live.