Time series plotter
With the Time series plotter ( ) you can visualise simulation results by plotting the variables you are interested in. All the variables that are stored in the NetCDF (and accompanying aggregated NetCDF in case aggregated were used in the simulation) can be plotted. An complete overview of the variables in the NetCDF can be found in the section Results 3Di. More information about aggregated variables can be found in the section Aggregated output.
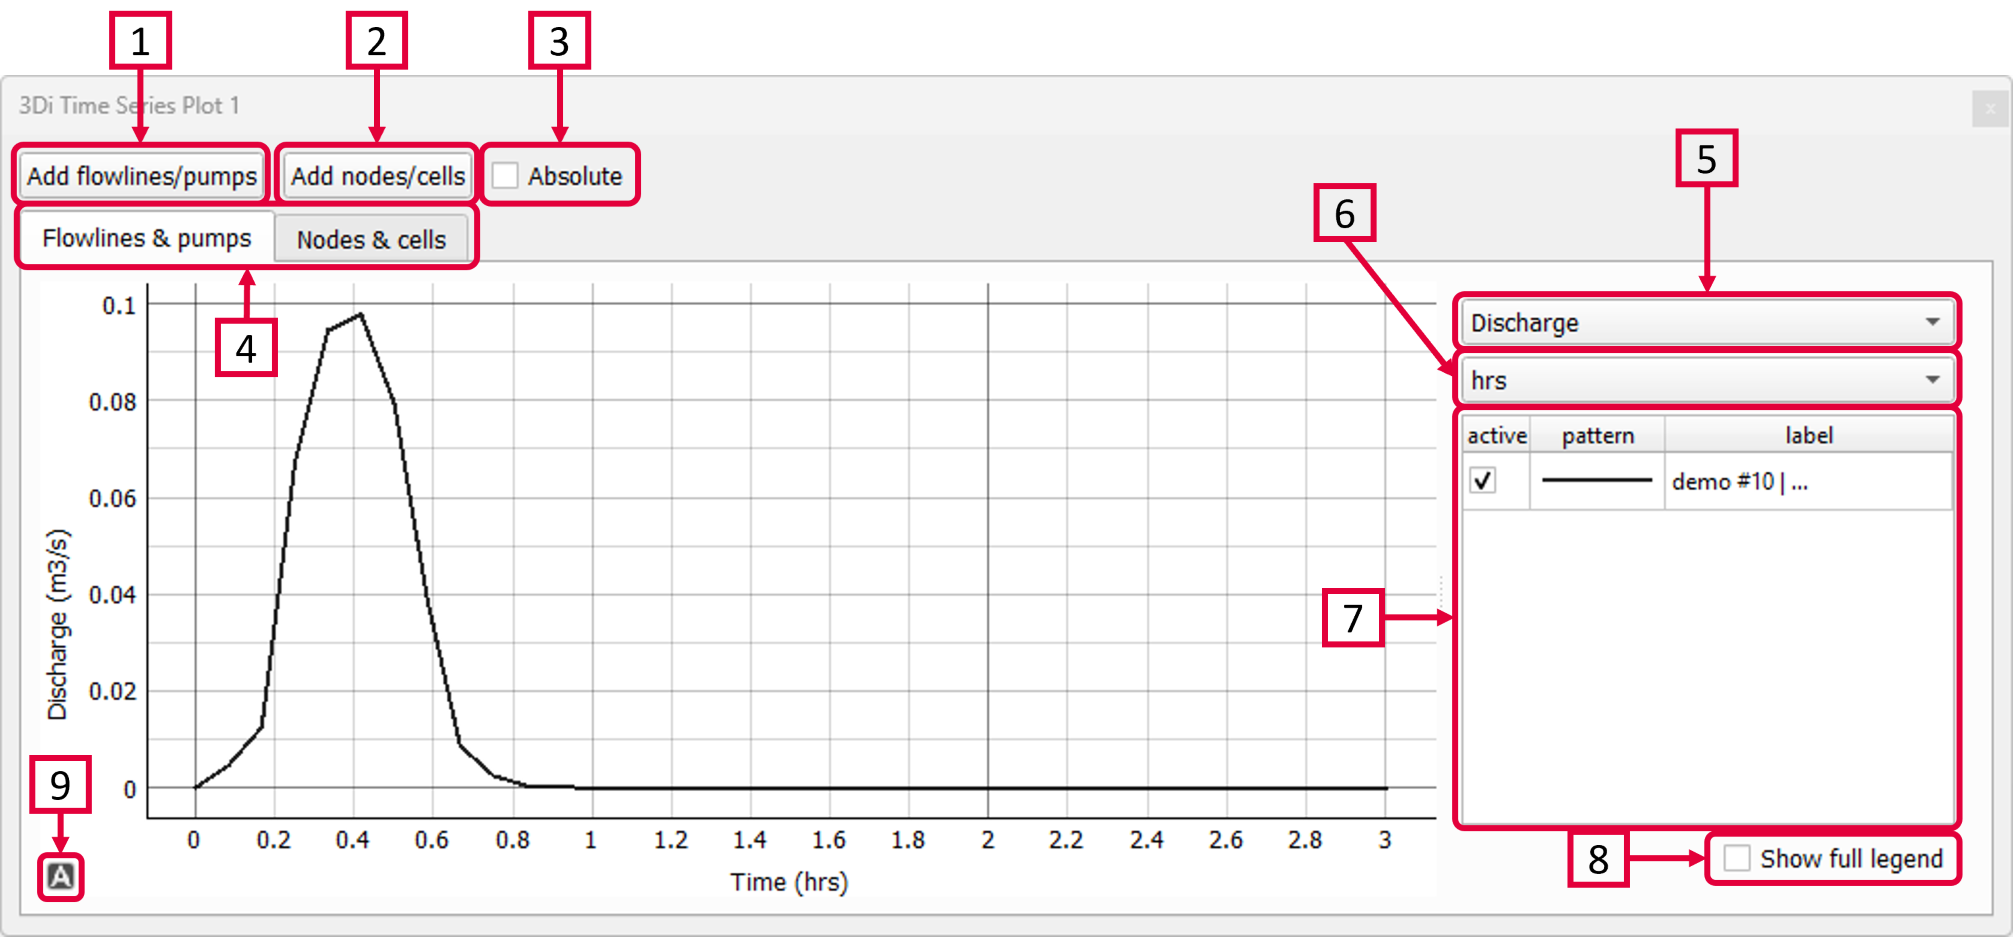
To analyse your results using the Time Series Plotter:
Click Add flowlines/pumps and then click a flowline or pumpline to plot the results of the clicked flowlines. To add multiple flowlines, simply click them one-by-one.
Click Add nodes/cells and then click a node or computational cell to plot the results of the clicked nodes/cells. To add multiple nodes/cells, simply click them one-by-one.
Check this box to make all the values absolute. This comes in handy when comparing flow in different directions.
You can switch between the results at flowlines and at nodes by clicking the corresponding tab.
Select the variable of interest.
Select the unit of time that is used for the X-axis. Choose between time in hours (default), minutes or seconds.
All the flowlines/nodes that have been added to the plotter are shown here. In case of multiple loaded results they are all shown here. This helps to compare different simulations of the same model. Check or uncheck the boxes in the first colomn to (de)activate the flowline/node from the graph. Right-click to remove a flowline/flow.
Check this box to see more information about the flowlines or nodes (used revision, flowline/node id, flowline/node type.
Click
 to recenter the graph. You can pan or zoom in and out on the plot itself and along either axis.
The plot-data can be exported as image or csv-file. Right-click the plot and choose ‘Export…’ from the drop-down menu. A new window pops up in which you can choose the desired output format. Click “Export” to select a location to save the data.