Vegetation
Local flow velocities are strongly affected by vegetation. In case of flooding applications, dense vegetation can alter routes for flooding and affect the arrival times of floods. Vegetation slows down the flow, allowing more time for infiltration and water buffering. In fluvial or in estuarine flow modelling, vegetation affects the flow route and it determines the shear stresses, which affects sedimentation and erosion patterns. Correct flow patterns are vital to preserve, improve and ensure the conditions for various animal and plant species.
Some model objectives for which modelling vegetation can be important include:
Assessing the effect of mangrove forest for flood protection
Balancing the ecological value of vegetation and the discharge capacities of waterways and floodplains.
Studying the discharge through stream that are lined with shrubs or other vegetation that inundates when water levels rise
Flood risk assessments in areas that are (partially) forested
Choosing the right method for schematising vegetation
3Di offers various methods for taking the effects of vegetation into account. Choosing the right method for schematising vegetation depends on the application, the model objective and data availability. Each use case is different and asks for some expert judgement. We can however provide some general guidelines.
Sheet flow If the flow depth is only a few millimeters to centimeters (e.g. sheet flow from hills), modelling vegetation will not have additional benefits. Using only bottom roughness (Manning or Chezy) will be sufficient.
Low vegetation Low vegetation is vegetation that has the height of the underlying bottom roughness. Generally, as soon as such an area gets wet, it is submerged and the height of the vegetation is in the same order of magnitude as the vertical accuracy of the DEM. Under these conditions it is advantageous to model the vegetation as a bottom roughness, using Manning or Chézy values. This method is available for 1D and 2D flow.
Medium to high vegetation In case the vegetation height is higher than the roughness layer at the bed, it can be advantageous to use vegetation drag. With this formulation, 3Di automatically takes into account the spatial variability and the changing water level conditions. This is especially important when measurement data is limited, and the system can only be calibrated under very specific conditions. This method captures the physics of flow through (partially) submerged vegetation, so the prediction capability improves. This method is available for 2D flow only.
Dense vegetation In case the vegetation is very dense, the vegetation drag formulation may not be the best representation of vegetation effects on flow. It may be more accurate to regard dense vegetation as a porous medium and use a porosity layer (interflow, available for 2D flow only). This is under investigation and the results will be published. More information can be found at Volp et al 2023, NCK Days and the paper that will be submitted in the Journal of Hydraulic Engineering.
Vegetation drag parameter values
If you want to use vegetation drag, you need to supply three input parameters to 3Di: vegetation height, vegetation stem count, vegetation stem diameter, and vegetation drag coefficient; see Vegetation drag settings for details. It can be a challenge to choose the correct values for these parameters. Even in acadamic research, the incorporation of vegetational effects in large scale hydrodynamic models is still a quite new, so there is not yet a large body of literature to draw from when setting these parameters.
The correct values for the vegetation parameters depend on the plant species, its growth stage and the season. The stem diameter, the height and the number of stems can be measured relatively easy, at least, compared to the drag coefficient. In the last decade, more and more measurements have been performed to define these values. Unfortunately, there is not a general overview of these values per species. Vargas-Luna et al. (2015) can serve as a starting point. In the formulation in 3Di, it is generally OK to start with a drag coefficient set to 1. Depending on the data you have of the area, it allows a more detailed calibration and tuning to the local conditions. The other parameters can be derived from land use maps and ecological maps.
Vegetation drag can only be used with friction type ‘Chezy’, because the vegetation formulation (initially introduced by Baptist 2005) uses Chezy.
Example: Biesbosch
To illustrate how vegetation drag parameters can be chosen for your use case, we will take the Biesbosch as an example. The Biesbosch is an estuary in the west of the Netherlands, near Rotterdam. A vegetation map is available from the Dutch national water management authority Rijkswaterstaat, see their viewer < https://maps.rijkswaterstaat.nl/geoweb55/index.html?viewer=Vegetatielegger>. This data can be added to your 3Di Modeller Interface project as an ArcGIS REST service, using this link: https://geo.rijkswaterstaat.nl/arcgis/rest/services/GDR/rws_vegetatielegger/FeatureServer .
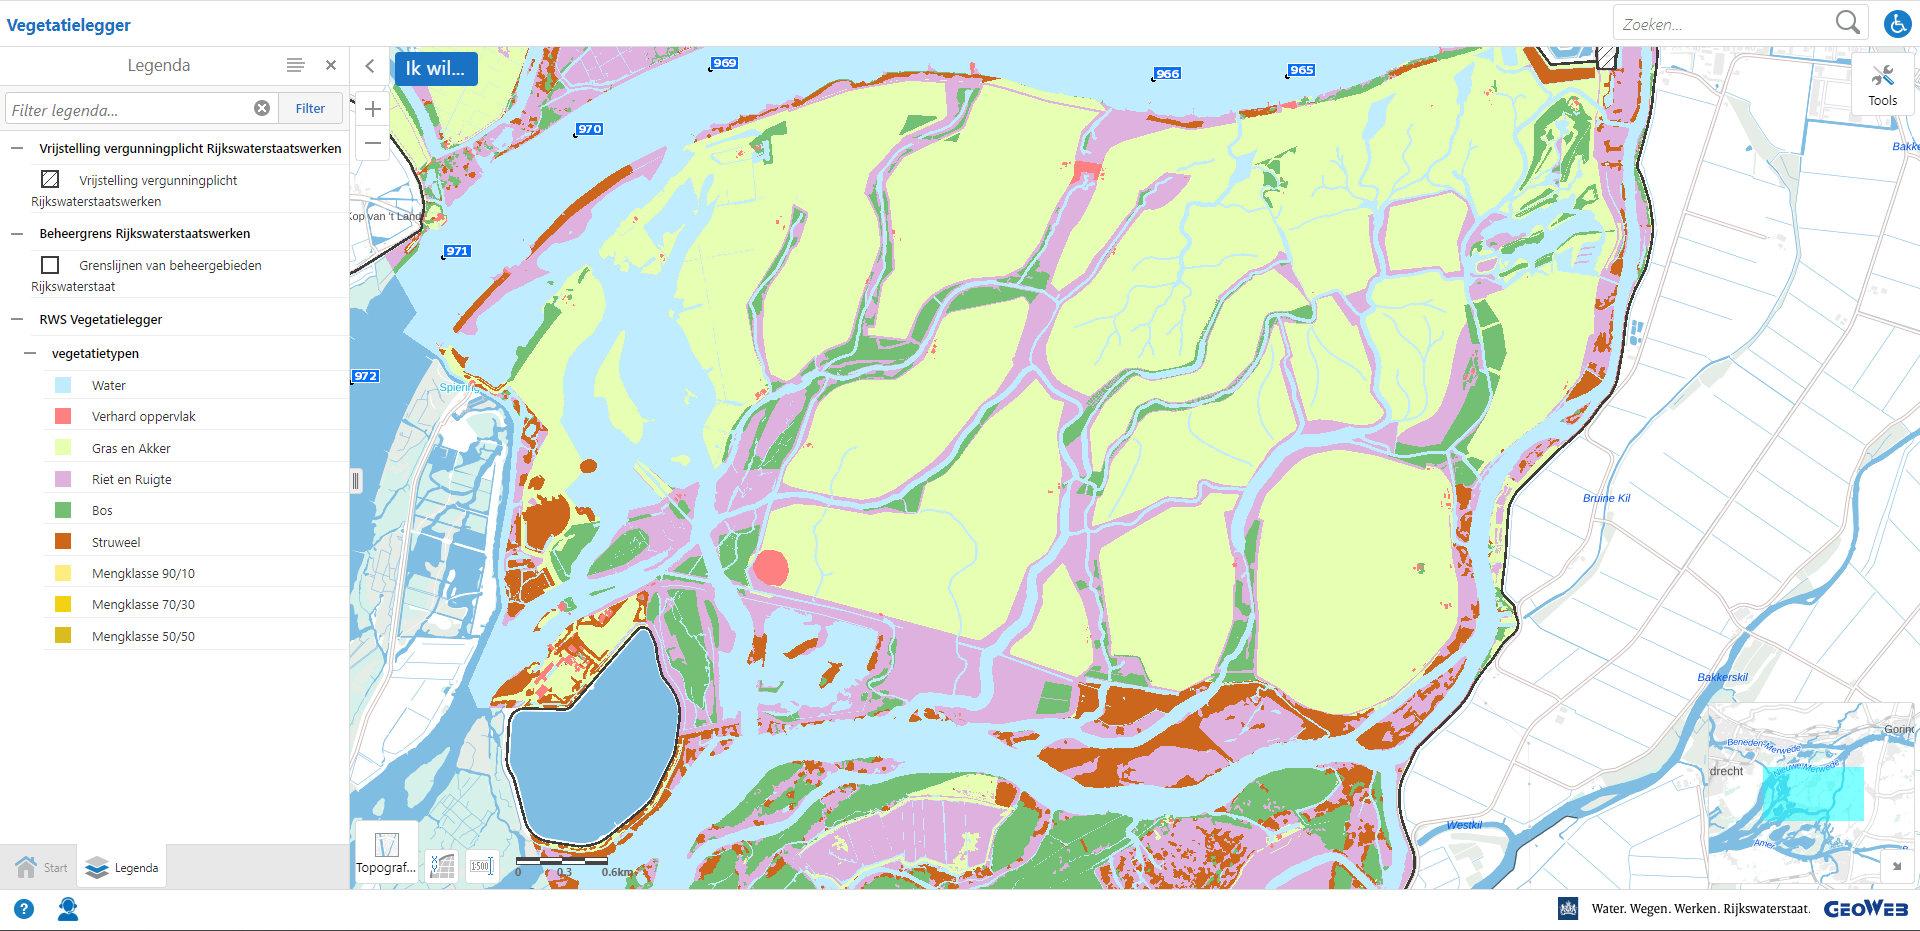
Fig. 6 Vegation map of the Biesbosch (Rijkswaterstaat vegetatielegger viewer).
The vegetation dataset has nine classes. An explanation of these classes is given in the Beeldenboek vegetatiebeheer grote rivieren <https://open.rws.nl/overige-publicaties/2020/beeldenboek-vegetatiebeheer-grote/>. Based in this information, we can make an educated guess for the vegetation parameters for these classes, summarized in this table:
Class in data |
English translation |
height |
stem count |
stem diameter |
Source |
|---|---|---|---|---|---|
Water |
water |
0 |
0 |
0 |
- |
Verhard oppervlak |
impervious area |
0 |
0 |
0 |
- |
Gras en akker |
grass and agricultural fields |
0.3 |
500 |
0.0025 |
Jin et al. (2019) |
Riet en ruigte |
reeds and thickets |
1.5 |
100 |
0.08 |
Ritterbusch (2007) |
Bos |
forest |
10 |
0.1 |
1 |
- |
Struweel |
shrubs and bushes |
3.5 |
50 |
0.02 |
- |
Mengklasse 90/10 |
mixed class 90/10 |
0.4 |
450 |
0.005 |
- |
Mengklasse 70/30 |
mixed class 70/30 |
0.7 |
380 |
0.01 |
- |
Calibrating flow through vegetation
Calibrating a model that includes vegetation drag is not fundamentally different from calibrating models that only include bottom friction. However, several things are helpful when starting the calibration process.
Vegetation height, stem count, and stem diameter should describe the vegetation as accurately as possible, based on what you know about the vegetation. The drag coefficient is the parameter that is specifically meant to account for all uncertainty that is not captured by the other parameters; i.e. this is the parameter to tune when calibrating the model. In the calculation of the vegetation drag, all vegetation parameters are multiplied, so tuning the drag coefficient will have the exact same effect as tuning any other vegetation parameter. For example, doubling the stem count will have the same effect as doubling the drag coefficient. You generally start with a drag coefficient of 1, and then increase it if the discharge is too high or decrease it if the discharge is too low.
Vegetation will usually have a much larger effect on the flow than bottom friction, unless the vegetation very short or sparse. Calibrating the friction coefficient will usually not make a lot of sense in such situations, as a large change in the friction coefficient will only have a small effect on velocity and discharge, while a small change in the drag coefficient will have a large effect.